

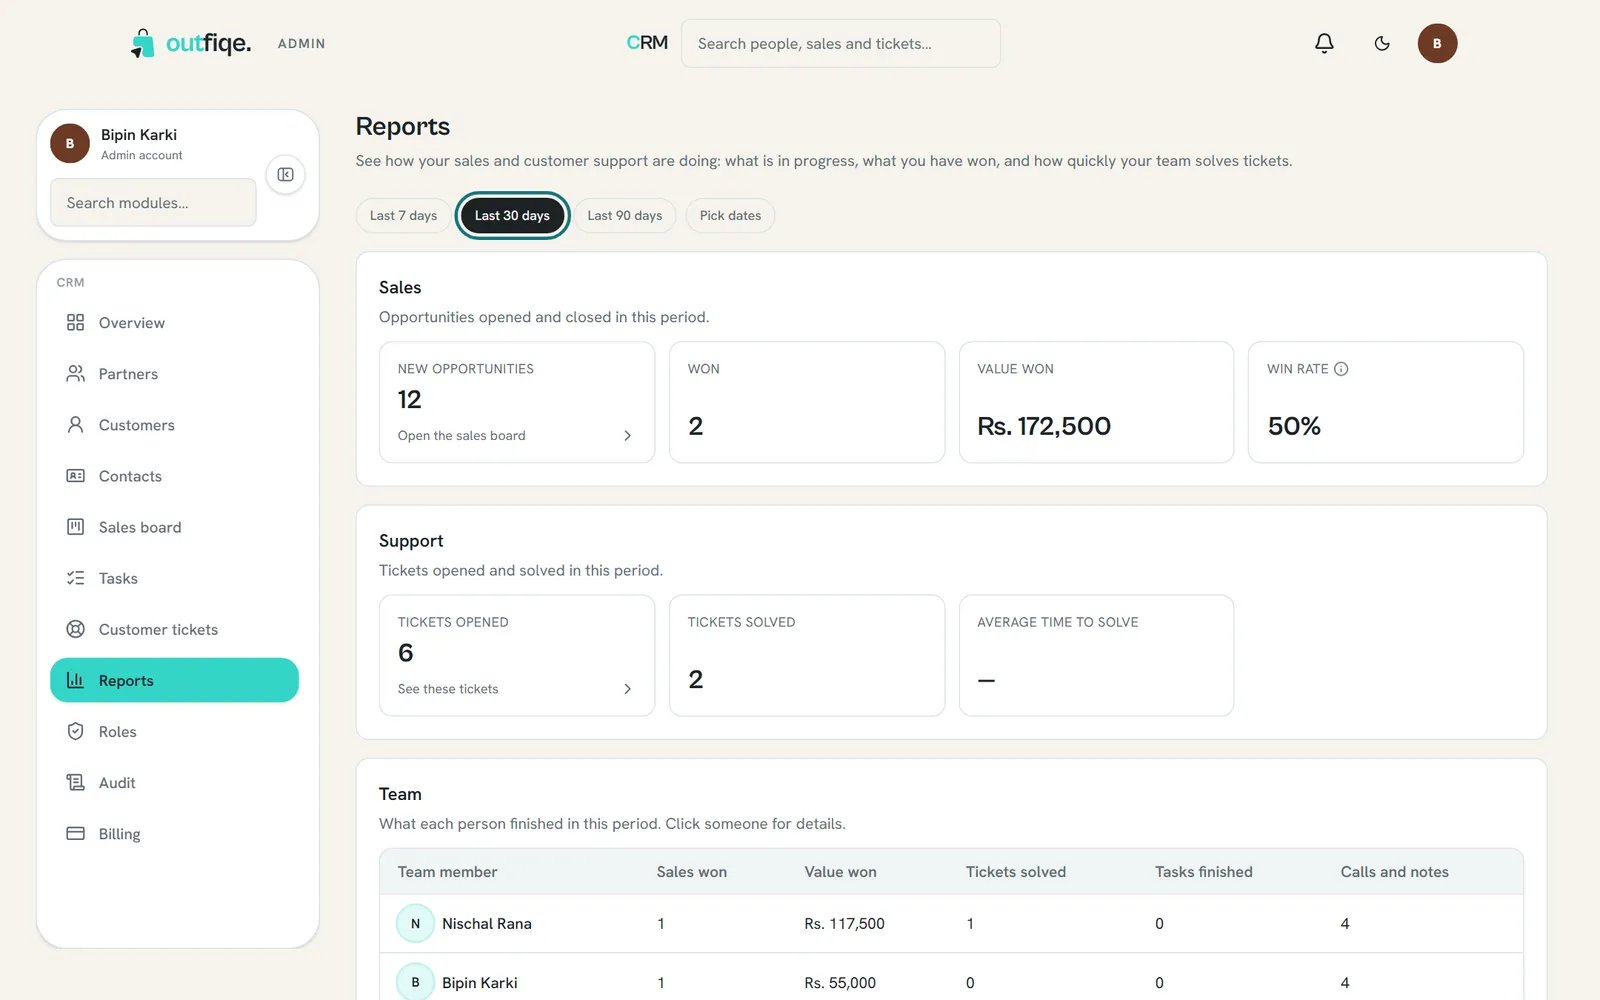
Change the period at the top, and every section updates.
What each section shows
Sales: opportunities opened and closed in the period. New opportunities, how many were Won, the Value won, and the Win rate: the share of closed opportunities you won. Support: tickets opened and solved in the period, and the Average time to solve. Team: what each person finished in the period: sales won, value won, tickets solved, tasks finished, and calls and notes logged. Choose a name to see more about that person. Sales right now: no matter the period, the value of everything still open, what’s been won, and how much money sits at each stage. Support right now: how many tickets are open or in progress, how many are resolved, and the average time to solve.Getting the most out of it
- Check Sales right now each week. A lot of money stuck in one stage often means opportunities that need a push. Turn on Stuck for 14+ days on the sales board to find them.
- If Average time to solve is climbing, look at who has the most open tickets under Team, and share them out.
- Many figures open the page behind them. Choose Open the sales board or See these tickets to go straight to the list.